2-Arm, Continuous Outcome, Repeated Measures - Patient Simulation
Shubham Lahoti
May 27, 2026
2ArmNormalRepeatedMeasuresResponseGeneration.RmdThis example is related to the Integration Point: Response - Continuous Outcome with Repeated Measures. Click the link for setup instructions, variable details, and additional information about this integration point.
- Study objective: Two Arm Confirmatory
- Number of endpoints: Single Endpoint
- Endpoint type: Continuous Outcome with Repeated Measures
- Task: Explore
Introduction
Repeated measures involve collecting multiple data points for the same variable from the same subjects across multiple time periods. This method provides insights into the subjects’ development and changes over time. In this context, a single subject can have multiple responses over time, and these responses can be correlated across different visits.
The following example illustrates how to integrate new patient outcome simulation (response) capabilities into East Horizon or East using R functions in the context of a two-arm trial with repeated measures.
Once CyneRgy is installed, you can load this example in RStudio with the following commands:
CyneRgy::RunExample( "2ArmNormalRepeatedMeasuresResponseGeneration" )Running the command above will load the RStudio project in RStudio.
RStudio Project File: 2ArmNormalRepeatedMeasuresResponseGeneration.Rproj
In the R directory of this example you will find the following R files:
GenerateResponseDiffOfMeansRepeatedMeasures.R - The R function named GenRespDiffOfMeansRepMeasures in the file is used to generate the normal responses across multiple visits for 2-arm normal repeated measures design.
LibraryMASS.R - This file is used to load the library
MASSto run themvrnormfunction.
Example 1 - Continuous Endpoint
This example is related to this R file: GenerateResponseDiffOfMeansRepeatedMeasures.R
For a continuous endpoint with repeated measures, the generation of
responses primarily depends on the mean and standard deviation across
all visits, as well as the correlation between these visits. This
examples uses built-in input variables coming from East Horizon or East
to simulate repeated measures data. It uses the
MASS::mvrnorm function. This example does not use any
user-defined parameters.
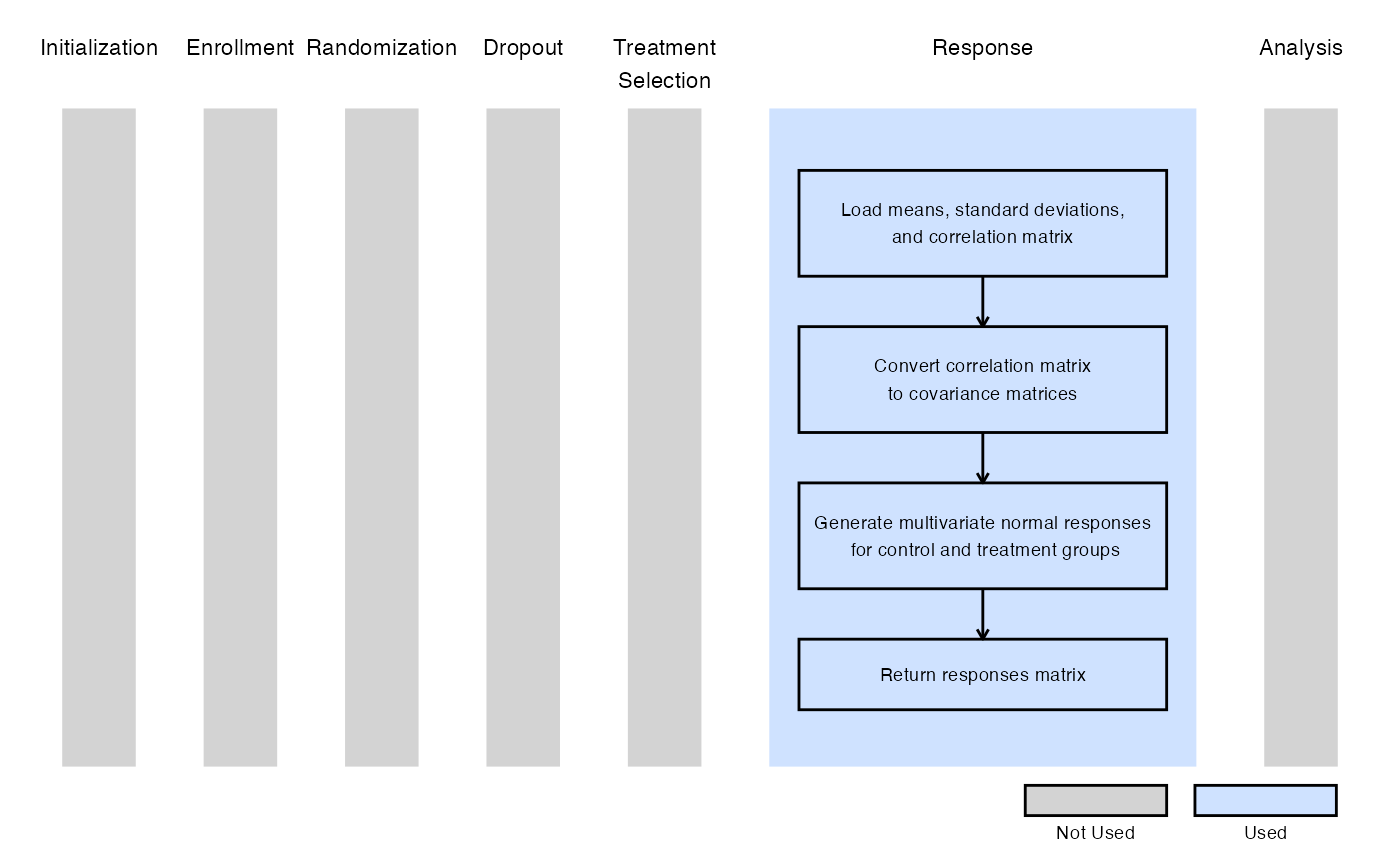
The figure below illustrates where this example fits within the R integration points of Cytel products, accompanied by a flowchart outlining the general steps performed by the R code.
Accessing Responses in Analysis
The data generation function returns a list object that includes
multiple repeated response variables, each corresponding to a specified
visit. These responses are stored as numeric vectors and are labeled
sequentially as Response1, Response2 and so
on, depending on the number of visits specified. These Response
variables serve as both outputs of the data generation step and inputs
for subsequent analyses. For the analysis, all the data is combined into
a SimData object (list of variables), therefore each
response can be accessed directly using the $ operator, for example:
SimData$Response1, SimData$Response2, etc.
This structure facilitates the handling of multiple outcomes in repeated
measures analyses. For further details on how to incorporate these
multiple responses into your analysis, refer to Integration Point:
Analysis - Continuous Outcome with Repeated Measures.