Integration Point: Response
Gabriel Potvin
July 07, 2026
IntegrationPointResponse.RmdGo back to the Getting Started: Overview page
Description
The Response integration point allows you to incorporate custom patient outcome simulation capabilities into East Horizon. By specifying a function, you can simulate patient outcomes according to your requirements, replacing the native generation method for patient response. For example, you can:
- Simulate patient data using a mixture distribution where a proportion of patients do not respond to treatment.
- Simulate patient data from a statistical distribution not natively
supported by East Horizon, such as:
- Gamma distribution for continuous outcomes,
- Beta distribution for binary outcomes,
- Weibull distribution for time-to-event outcomes.
Availability
Note: This integration point is compatible with Sample Size Re-Estimation (standard templates and examples are compatible) and Stratification/Subpopulations (distinct templates and examples were created for Stratification and are compatible with Subpopulations).
East Horizon Explore
This integration point is available in East Horizon Explore for the following study objectives and endpoint types:
| Time to Event | Time to Event with Stratification | Binary | Continuous | Continuous with Repeated Measures | Count | Composite | Categorical | Dual TTE-TTE | Dual TTE-Binary | ||
|---|---|---|---|---|---|---|---|---|---|---|---|
| Dose Escalation | - | - | - | - | - | - | - | - | - | - | |
| Dose Finding | - | - | - | ❌ | - | - | - | - | - | - | |
| Multiple Arm Confirmatory | ❌ | - | ✅ | ✅ | - | - | - | - | - | - | |
| One Arm Exploratory / Confirmatory | - | - | - | - | - | - | - | - | - | - | |
| Two Arm Confirmatory | ✅ | ✅ | ✅ | ✅ | ✅ | ❌ | - | - | ✅ | ✅ | |
| Two Arm Confirmatory - Multiple Endpoints | ✅ | - | ✅ | ✅ | - | - | - | - | - | - |
East Horizon Design
This integration point is available in East Horizon Design for the following study objectives and endpoint types (click to expand/collapse):
| Time to Event | Time to Event with Stratification | Binary | Continuous | Continuous with repeated measures | Count | Composite | Categorical | Dual TTE-TTE | Dual TTE-Binary | |
|---|---|---|---|---|---|---|---|---|---|---|
| Dose Escalation | - | - | ❌ | - | - | - | - | - | - | - |
| Dose Finding | - | - | ❌ | ❌ | - | - | - | - | - | - |
| Multiple Arm Confirmatory | ✅† | - | ✅† | ✅† | - | - | - | - | - | - |
| One Arm Exploratory / Confirmatory | ❌ | - | ❌ | ❌ | - | ❌ | - | ❌ | - | - |
| Two Arm Confirmatory | ✅† | ✅† | ✅† | ✅† | - | ❌ | ❌ | - | ❌ | ❌ |
| Two Arm Confirmatory - Multiple Endpoints | ✅ | - | ✅ | ✅ | - | - | - | - | - |
†Not every test will be available for this study objective and endpoint type. The availability will depend on the specific test you choose:
| Test | Study Objective | Endpoint | Availability |
|---|---|---|---|
| Logrank Test Given Accrual Duration and Accrual Rates (Parallel Design) | Two Arm Confirmatory | Time to Event | ✅ |
| Logrank Test Given Accrual Duration and Study Duration (Parallel Design) | Two Arm Confirmatory | Time to Event | ✅ |
| Logrank Test Given Accrual Duration and Accrual Rates (Population Enrichment) | Two Arm Confirmatory | Time to Event | ❌ |
| Difference of Proportions (Parallel Design) | Two Arm Confirmatory | Binary | ✅ |
| Ratio of Proportions (Parallel Design) | Two Arm Confirmatory | Binary | ✅ |
| Odds Ratio of Proportions (Parallel Design) | Two Arm Confirmatory | Binary | ✅ |
| Fisher’s Exact (Parallel Design) | Two Arm Confirmatory | Binary | ❌ |
| Difference of Means (Parallel Design) | Two Arm Confirmatory | Continuous | ✅ |
| Ratio of Means (Parallel Design) | Two Arm Confirmatory | Continuous | ❌ |
| Difference of Means (Crossover Design) | Two Arm Confirmatory | Continuous | ❌ |
| Ratio of Means (Crossover Design) | Two Arm Confirmatory | Continuous | ❌ |
| MAMS Logrank: Combining P-Values (Pairwise Comparisons to Control) | Multiple Arm Confirmatory | Time to Event | ✅ |
| MAMS Difference of Proportions (Pairwise Comparisons to Control) | Multiple Arm Confirmatory | Binary | ❌ |
| MAMS Difference of Proportions: Combining P-Values (Pairwise Comparisons to Control) | Multiple Arm Confirmatory | Binary | ✅ |
| MAMS Difference of Means (Pairwise Comparisons to Control) | Multiple Arm Confirmatory | Continuous | ❌ |
| MAMS Difference of Means: Combining P-Values (Pairwise Comparisons to Control) | Multiple Arm Confirmatory | Continuous | ✅ |
East
This integration point is available in East for the following tests (click to expand/collapse):
| Test | Number of Samples | Endpoint | Availability |
|---|---|---|---|
| Difference of Means (Parallel Design) | Two Samples | Continuous | ✅ |
| Difference of Proportions (Parallel Design) | Two Samples | Discrete | ✅ |
| Ratio of Proportions (Parallel Design) | Two Samples | Discrete | ✅ |
| Odds Ratio of Proportions (Parallel Design) | Two Samples | Discrete | ✅ |
| Logrank Test Given Accrual Duration and Accrual Rates (Parallel Design) | Two Samples | Survival | ✅ |
| Logrank Test Given Accrual Duration and Study Duration (Parallel Design) | Two Samples | Survival | ✅ |
| Chi-Square for Specified Proportions in C Categories (Single Arm Design) | Many Samples | Discrete | ✅ |
| Two Group Chi-Square for Proportions in C Categories (Parallel Design) | Many Samples | Discrete | ✅ |
| Multiple Looks - Combining P-Values (Pairwise Comparisons to Control - Difference of Means) | Many Samples | Continuous | ❌ |
| Multiple Looks - Combining P-Values (Multiple Pairwise Comparisons to Control - Difference of Proportions) | Many Samples | Discrete | ❌ |
| Multiple Looks - Combining P-Values (Pairwise Comparisons to Control - Logrank Test) | Many Samples | Survival | ❌ |
Instructions
In East Horizon Explore
You can set up a response function under Distribution in a Response Card while creating or editing an Input Set.
Follow these steps (click to expand/collapse):
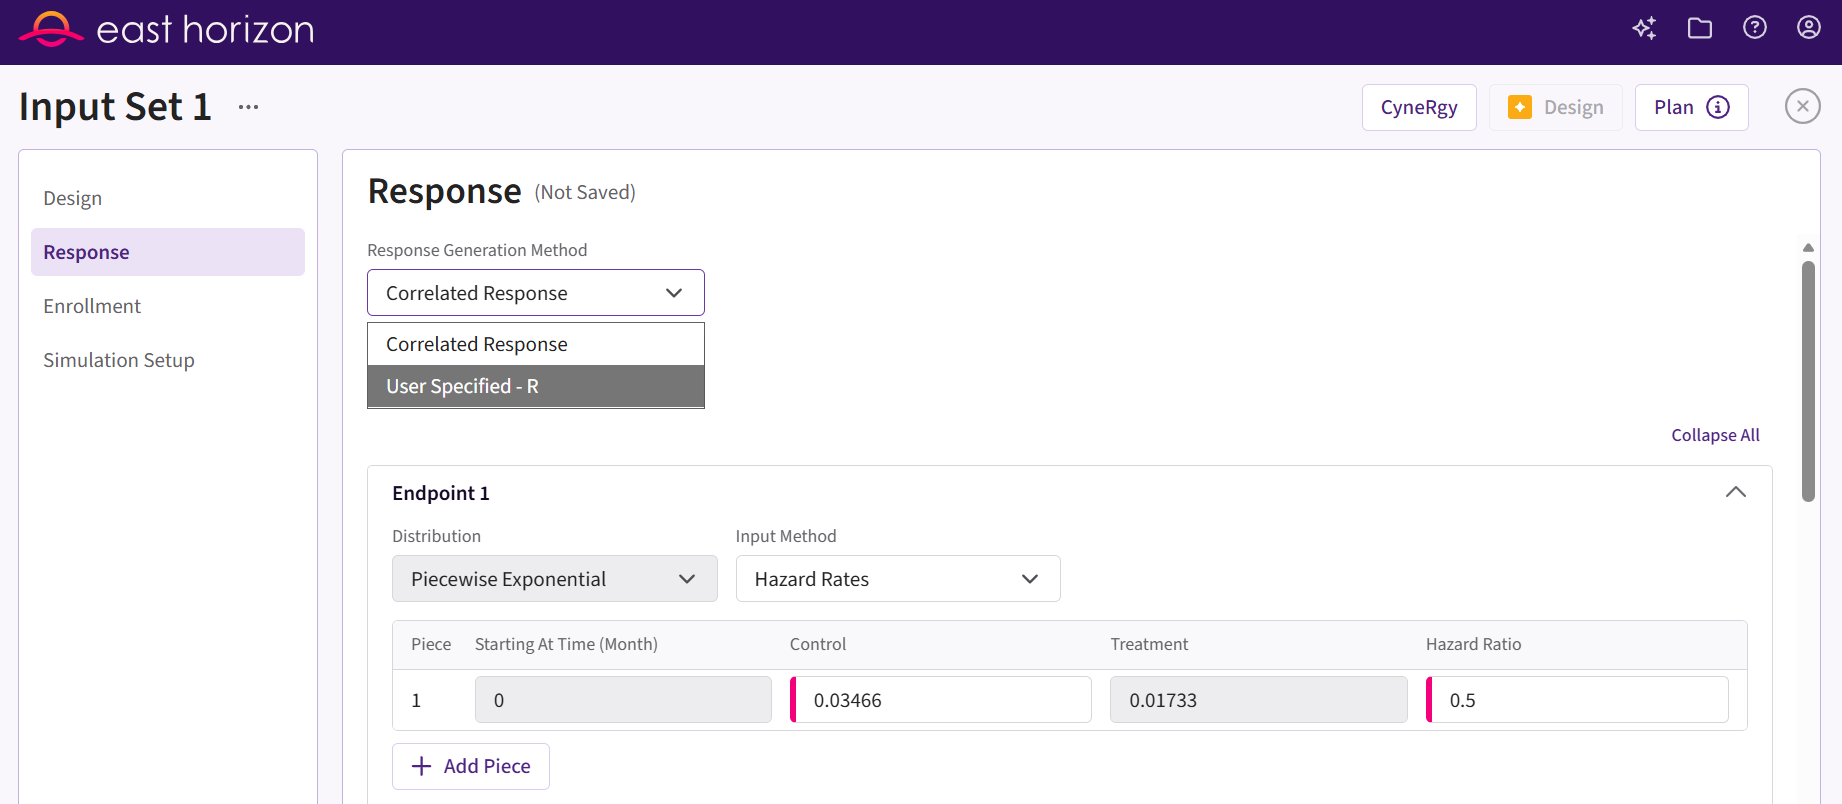
- Select User Specified-R from the dropdown in the Distribution field in the Response Card. For Dual Endpoints, it will be under Response Generation Method.
- Browse and select the appropriate R file (
filename.r) from your computer, or use the built-in R Code Assistant to create one. This file should contain function(s) written to perform various tasks to be used throughout your Project. - Choose the appropriate function name. If the expected function is not displaying, then check your R code for errors.
- Set any required user parameters (variables) as needed for your function using + Add Variables.
- Continue creating your project.
For a visual guide of where to find the option, refer to the screenshot below:
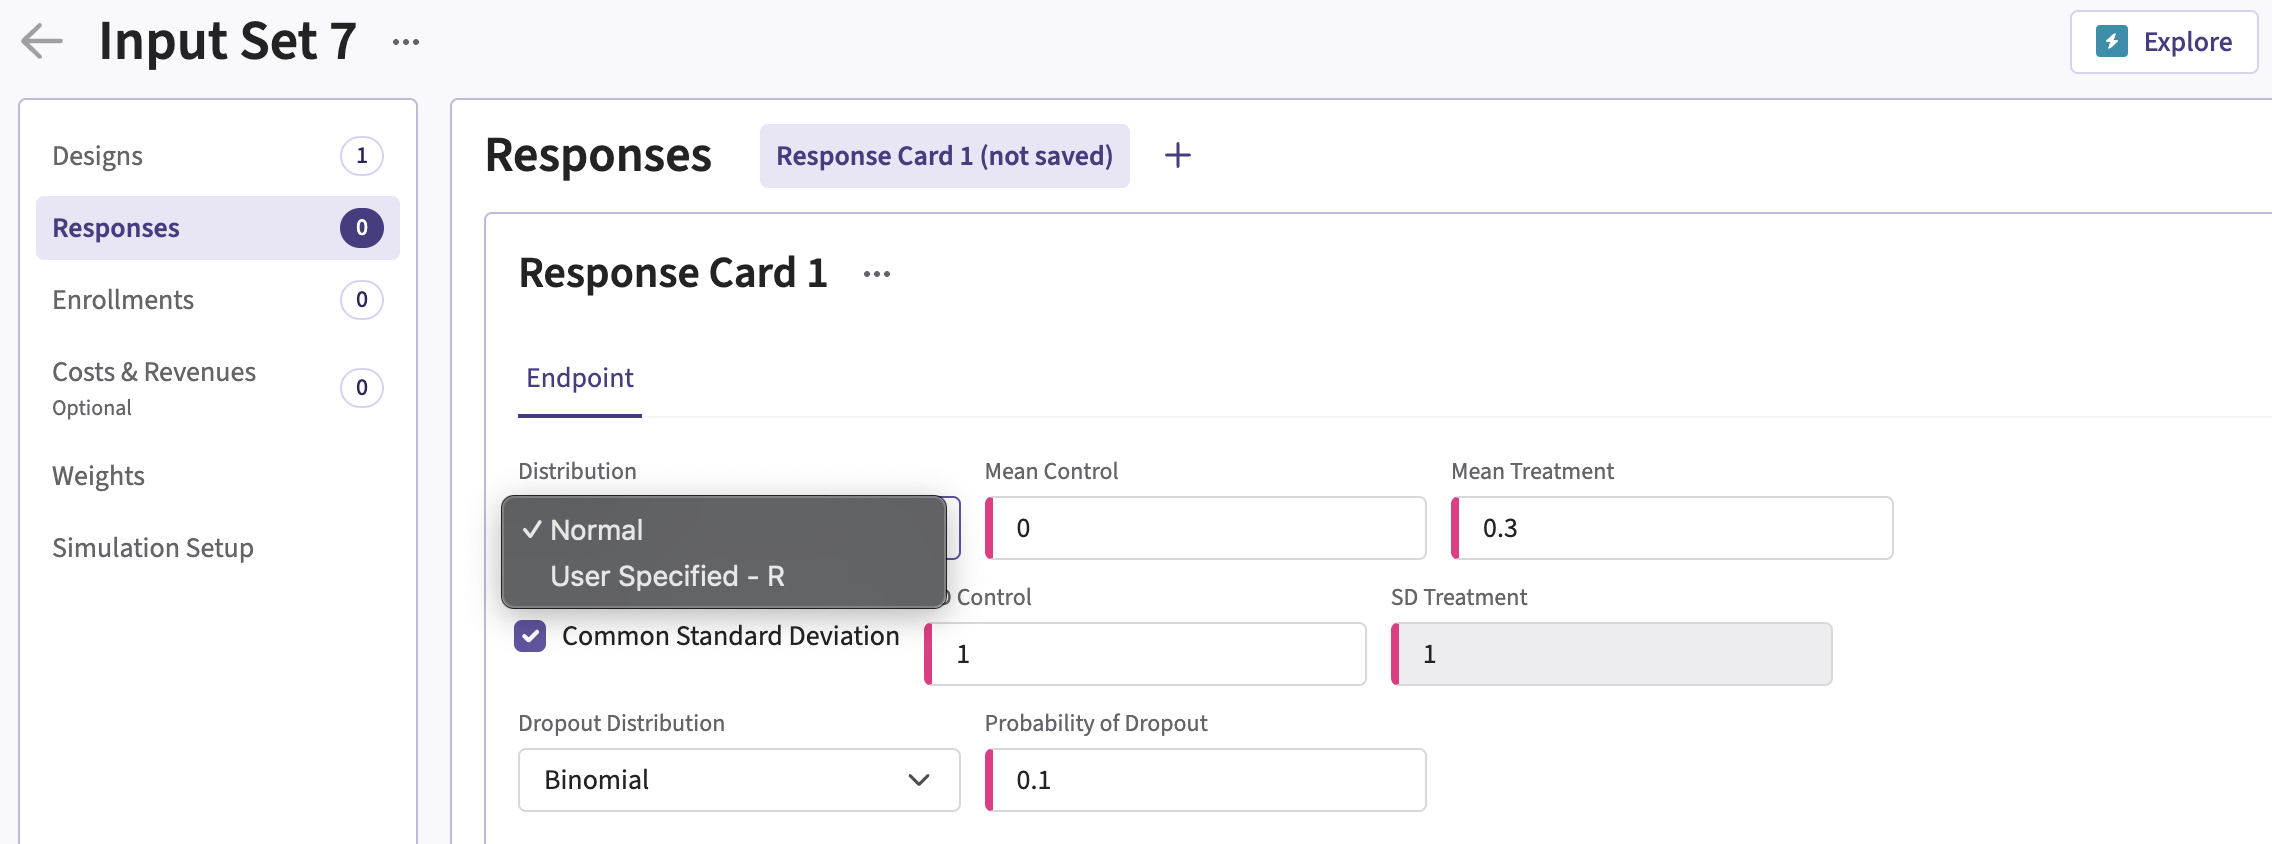
For Multiple Endpoints, the option is available under Response Generation Method.
In East Horizon Design
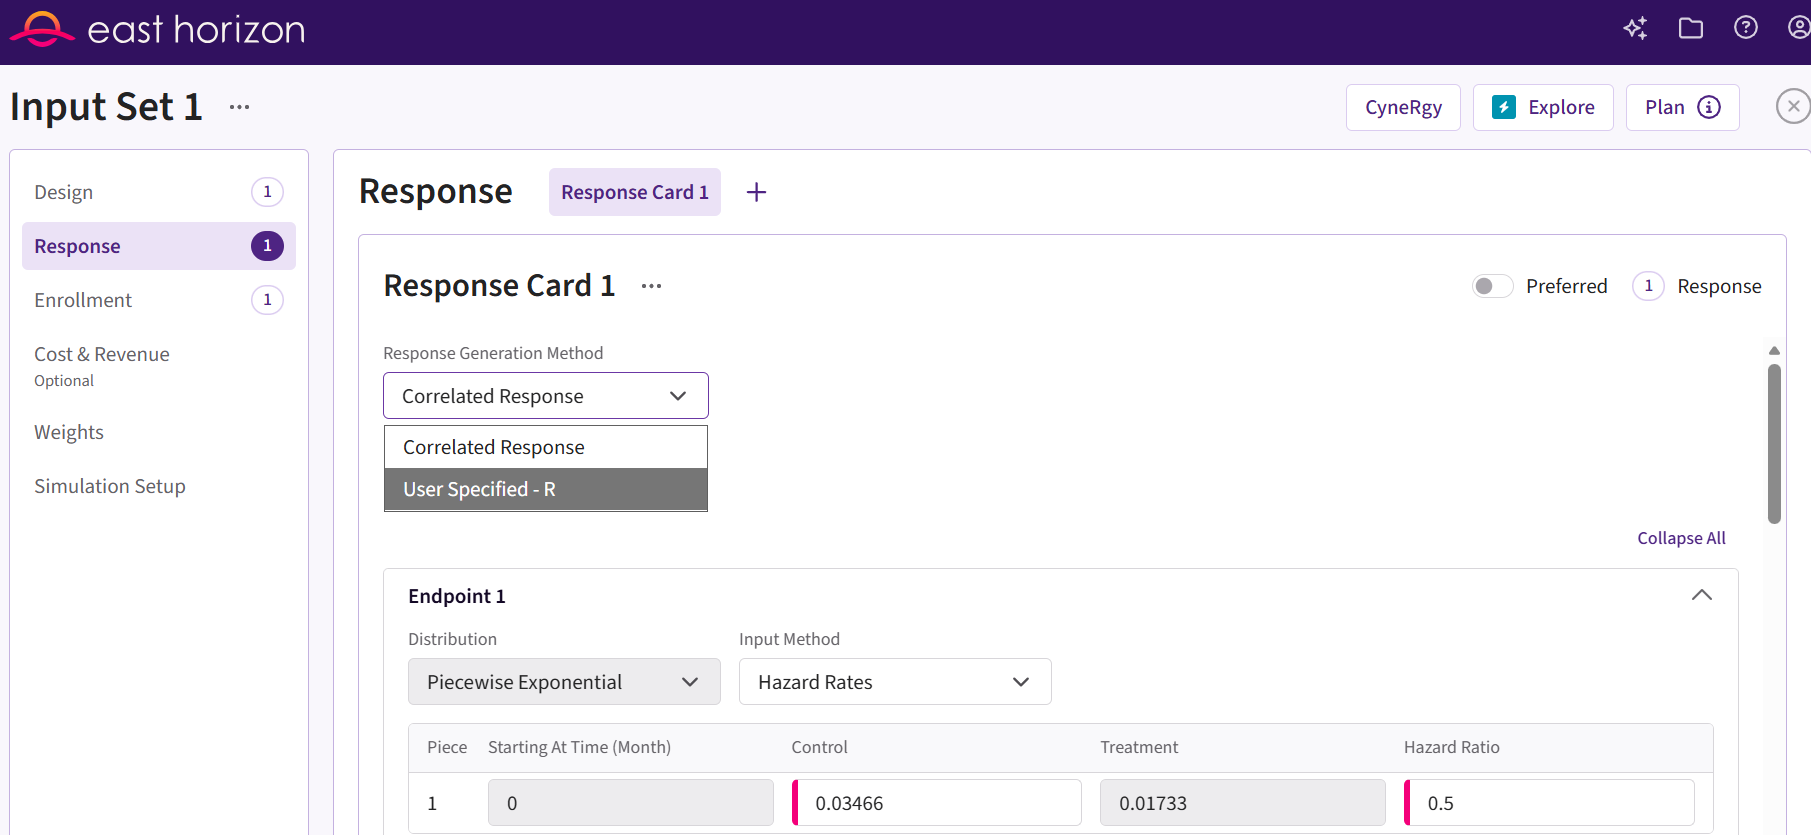
You can set up a response function under Distribution in the Response section of an Input Set created by simulation.
Follow these steps (click to expand/collapse):
- Create an simulation input set. For some tests, you may need to create an analytical design input set first. If so, follow the steps 2 and 3. If not, skip to step 4.
- Navigate to the Results section and simulate the analytical design.
- Navigate to the new simulation input set that was created.
- Select User Specified-R from the dropdown in the Distribution (or Response Generation Method) field in the Response tab.
- Browse and select the appropriate R file (
filename.r) from your computer, or use the built-in R Code Assistant to create one. This file should contain function(s) written to perform various tasks to be used throughout your Project. - Choose the appropriate function name. If the expected function is not displaying, then check your R code for errors.
- Set any required user parameters (variables) as needed for your function using + Add Variables.
- Continue creating your project.
For a visual guide of where to find the option, refer to the screenshot below:
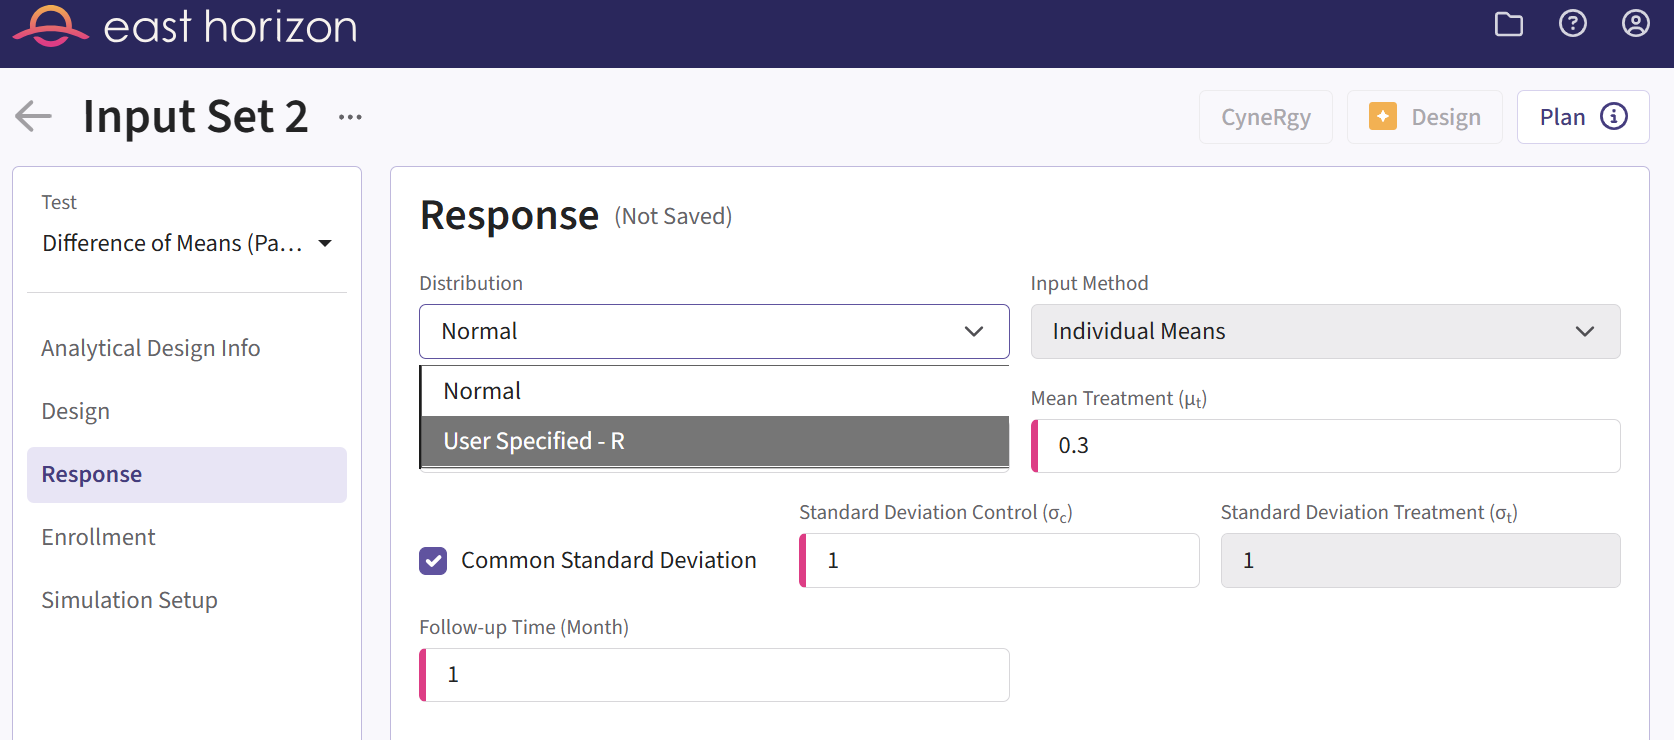
For Multiple Endpoints, the option is available under Response Generation Method.
In East
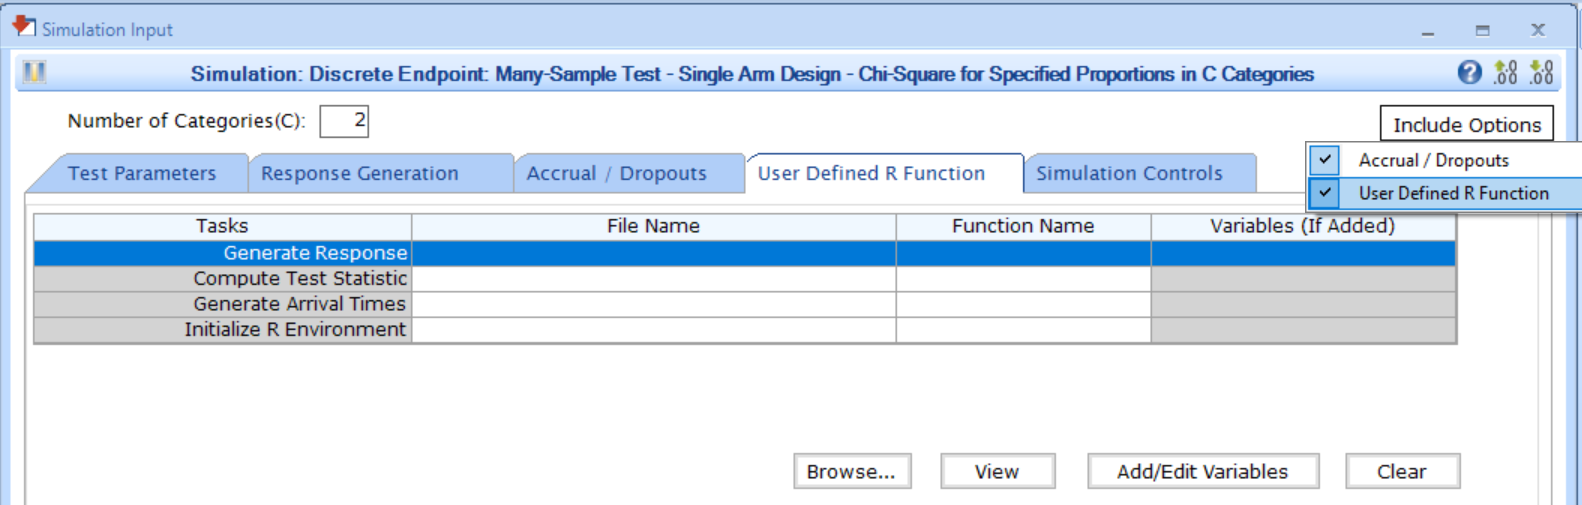
You can set up a response function by navigating to the Generate Response task of the User Defined R Function tab of a Simulation Input window, after including the option.
Follow these steps (click to expand/collapse):
- Choose the appropriate test in the Design tab.
- If you see the Design Input window, compute the scenario using the Compute button, save the design using the Save in Workbook button, then navigate to the Simulation Input window by clicking on the Simulate Design button under Library.
- Click on the Include Options button on the top right corner of the Simulation Input window and select both Accrual / Dropouts and User Defined R Function.
- In the tab User Defined R Function, a list of tasks will appear. Place your cursor in the File Name field for the task Generate Response.
- Click on the button Browse… to select the
appropriate R file (
filename.r) from your computer. This file should contain function(s) written to perform various tasks to be used throughout your Project. - Specify the function name you want to initialize. To copy the function’s name from the R script, click on the button View.
- Set any required user parameters (variables) as needed for your function using the button Add/Edit Variables.
- Continue setting up your project.
For a visual guide of where to find the option, refer to the screenshot below: