Integration Point: Analysis
Gabriel Potvin
July 07, 2026
IntegrationPointAnalysis.RmdGo back to the Getting Started: Overview page
Description
The Analysis integration point allows you to customize the statistical test for the treatment effect using a custom R script. This flexibility enables you to implement methods that better align with your trial’s specific needs, rather than relying on the built-in default statistical tests. For example:
- Continuous outcomes: Instead of using the default difference of means, you could provide a script for alternative approaches such as the ratio of means or a test from the Wilcoxon-Mann-Whitney family.
- Binary outcomes: Instead of the default difference of proportions, you could implement methods such as the risk ratio or other suitable measures.
- Time-to-Event outcomes: Instead of the default Logrank test, you could include scripts for alternative approaches like the Peto-Peto test, which emphasizes early events, or a restricted mean survival time (RMST)-based test, which describes the mean event-free survival time up to a pre-selected time point.
Availability
Note: This integration point is compatible with Sample Size Re-Estimation (distinct templates and examples were created for SSR) and Stratification/Subpopulations (distinct templates and examples were created for Stratification and Stratification with Subpopulations).
East Horizon Explore
This integration point is available in East Horizon Explore for the following study objectives and endpoint types:
| Time to Event | Time to Event with Stratification | Binary | Continuous | Continuous with Repeated Measures | Count | Composite | Categorical | Dual TTE-TTE | Dual TTE-Binary | ||
|---|---|---|---|---|---|---|---|---|---|---|---|
| Dose Escalation | - | - | - | - | - | - | - | - | - | - | |
| Dose Finding | - | - | - | ✅ | - | - | - | - | - | - | |
| Multiple Arm Confirmatory | ❌ | - | ✅ | ✅ | - | - | - | - | - | - | |
| One Arm Exploratory / Confirmatory | - | - | - | - | - | - | - | - | - | - | |
| Two Arm Confirmatory | ✅ | ✅ | ✅ | ✅ | ✅ | ❌ | - | - | ✅ | ✅ | |
| Two Arm Confirmatory - Multiple Endpoints | ❌* | - | ❌* | ❌* | - | - | - | - | - | - |
*For Multiple Endpoints, you can use the Integration Point: Design to implement your own test statistic and decision.
East Horizon Design
This integration point is available in East Horizon Design for the following study objectives and endpoint types (click to expand/collapse):
| Time to Event | Time to Event with Stratification | Binary | Continuous | Continuous with repeated measures | Count | Composite | Categorical | Dual TTE-TTE | Dual TTE-Binary | |
|---|---|---|---|---|---|---|---|---|---|---|
| Dose Escalation | - | - | ❌ | - | - | - | - | - | - | - |
| Dose Finding | - | - | ❌ | ❌ | - | - | - | - | - | - |
| Multiple Arm Confirmatory | ✅† | - | ✅† | ✅† | - | - | - | - | - | - |
| One Arm Exploratory / Confirmatory | ❌ | - | ❌ | ❌ | - | ❌ | - | ❌ | - | - |
| Two Arm Confirmatory | ✅† | ✅† | ✅† | ✅† | - | ❌ | ❌ | - | ❌ | ❌ |
| Two Arm Confirmatory - Multiple Endpoints | ❌* | - | ❌* | ❌* | - | - | - | - | - |
*For Multiple Endpoints, you can use the Integration Point: Design to implement your own test statistic and decision.
†Not every test will be available for this study objective and endpoint type. The availability will depend on the specific test you choose:
| Test | Study Objective | Endpoint | Availability |
|---|---|---|---|
| Logrank Test Given Accrual Duration and Accrual Rates (Parallel Design) | Two Arm Confirmatory | Time to Event | ✅ |
| Logrank Test Given Accrual Duration and Study Duration (Parallel Design) | Two Arm Confirmatory | Time to Event | ✅ |
| Logrank Test Given Accrual Duration and Accrual Rates (Population Enrichment) | Two Arm Confirmatory | Time to Event | ❌ |
| Difference of Proportions (Parallel Design) | Two Arm Confirmatory | Binary | ✅ |
| Ratio of Proportions (Parallel Design) | Two Arm Confirmatory | Binary | ✅ |
| Odds Ratio of Proportions (Parallel Design) | Two Arm Confirmatory | Binary | ✅ |
| Fisher’s Exact (Parallel Design) | Two Arm Confirmatory | Binary | ❌ |
| Difference of Means (Parallel Design) | Two Arm Confirmatory | Continuous | ✅ |
| Ratio of Means (Parallel Design) | Two Arm Confirmatory | Continuous | ❌ |
| Difference of Means (Crossover Design) | Two Arm Confirmatory | Continuous | ❌ |
| Ratio of Means (Crossover Design) | Two Arm Confirmatory | Continuous | ❌ |
| MAMS Logrank: Combining P-Values (Pairwise Comparisons to Control) | Multiple Arm Confirmatory | Time to Event | ✅ |
| MAMS Difference of Proportions (Pairwise Comparisons to Control) | Multiple Arm Confirmatory | Binary | ❌ |
| MAMS Difference of Proportions: Combining P-Values (Pairwise Comparisons to Control) | Multiple Arm Confirmatory | Binary | ✅ |
| MAMS Difference of Means (Pairwise Comparisons to Control) | Multiple Arm Confirmatory | Continuous | ❌ |
| MAMS Difference of Means: Combining P-Values (Pairwise Comparisons to Control) | Multiple Arm Confirmatory | Continuous | ✅ |
East
This integration point is available in East for the following tests (click to expand/collapse):
| Test | Number of Samples | Endpoint | Availability |
|---|---|---|---|
| Difference of Means (Parallel Design) | Two Samples | Continuous | ✅ |
| Difference of Proportions (Parallel Design) | Two Samples | Discrete | ✅ |
| Ratio of Proportions (Parallel Design) | Two Samples | Discrete | ✅ |
| Odds Ratio of Proportions (Parallel Design) | Two Samples | Discrete | ✅ |
| Logrank Test Given Accrual Duration and Accrual Rates (Parallel Design) | Two Samples | Survival | ✅ |
| Logrank Test Given Accrual Duration and Study Duration (Parallel Design) | Two Samples | Survival | ✅ |
| Chi-Square for Specified Proportions in C Categories (Single Arm Design) | Many Samples | Discrete | ✅ |
| Two Group Chi-Square for Proportions in C Categories (Parallel Design) | Many Samples | Discrete | ✅ |
| Multiple Looks - Combining P-Values (Pairwise Comparisons to Control - Difference of Means) | Many Samples | Continuous | ❌ |
| Multiple Looks - Combining P-Values (Multiple Pairwise Comparisons to Control - Difference of Proportions) | Many Samples | Discrete | ❌ |
| Multiple Looks - Combining P-Values (Pairwise Comparisons to Control - Logrank Test) | Many Samples | Survival | ❌ |
Instructions
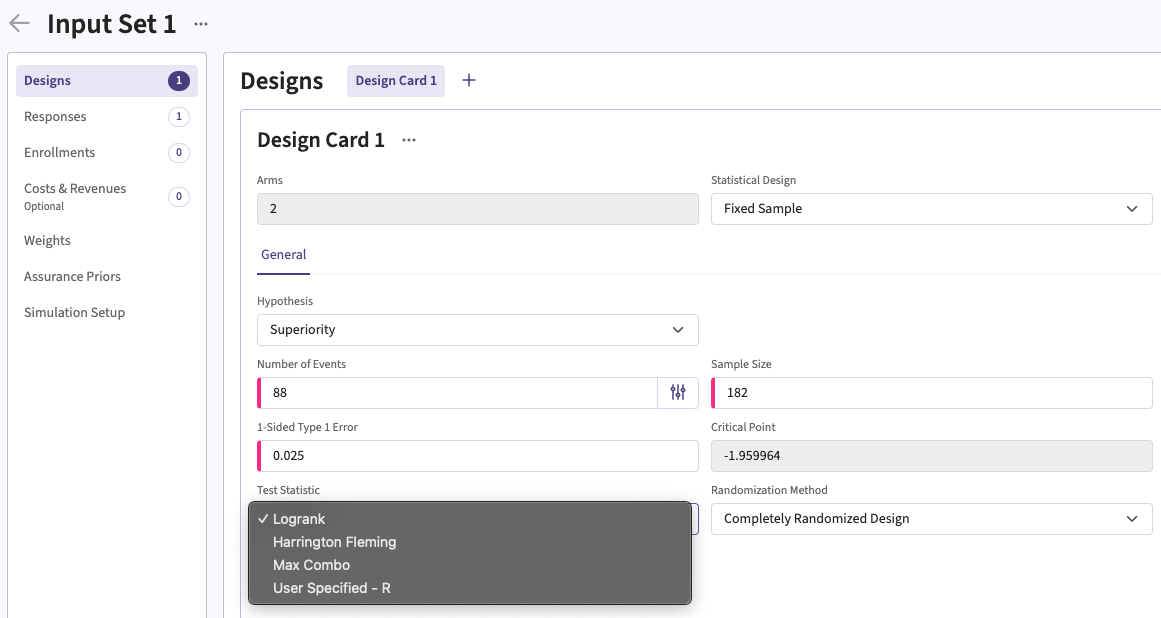
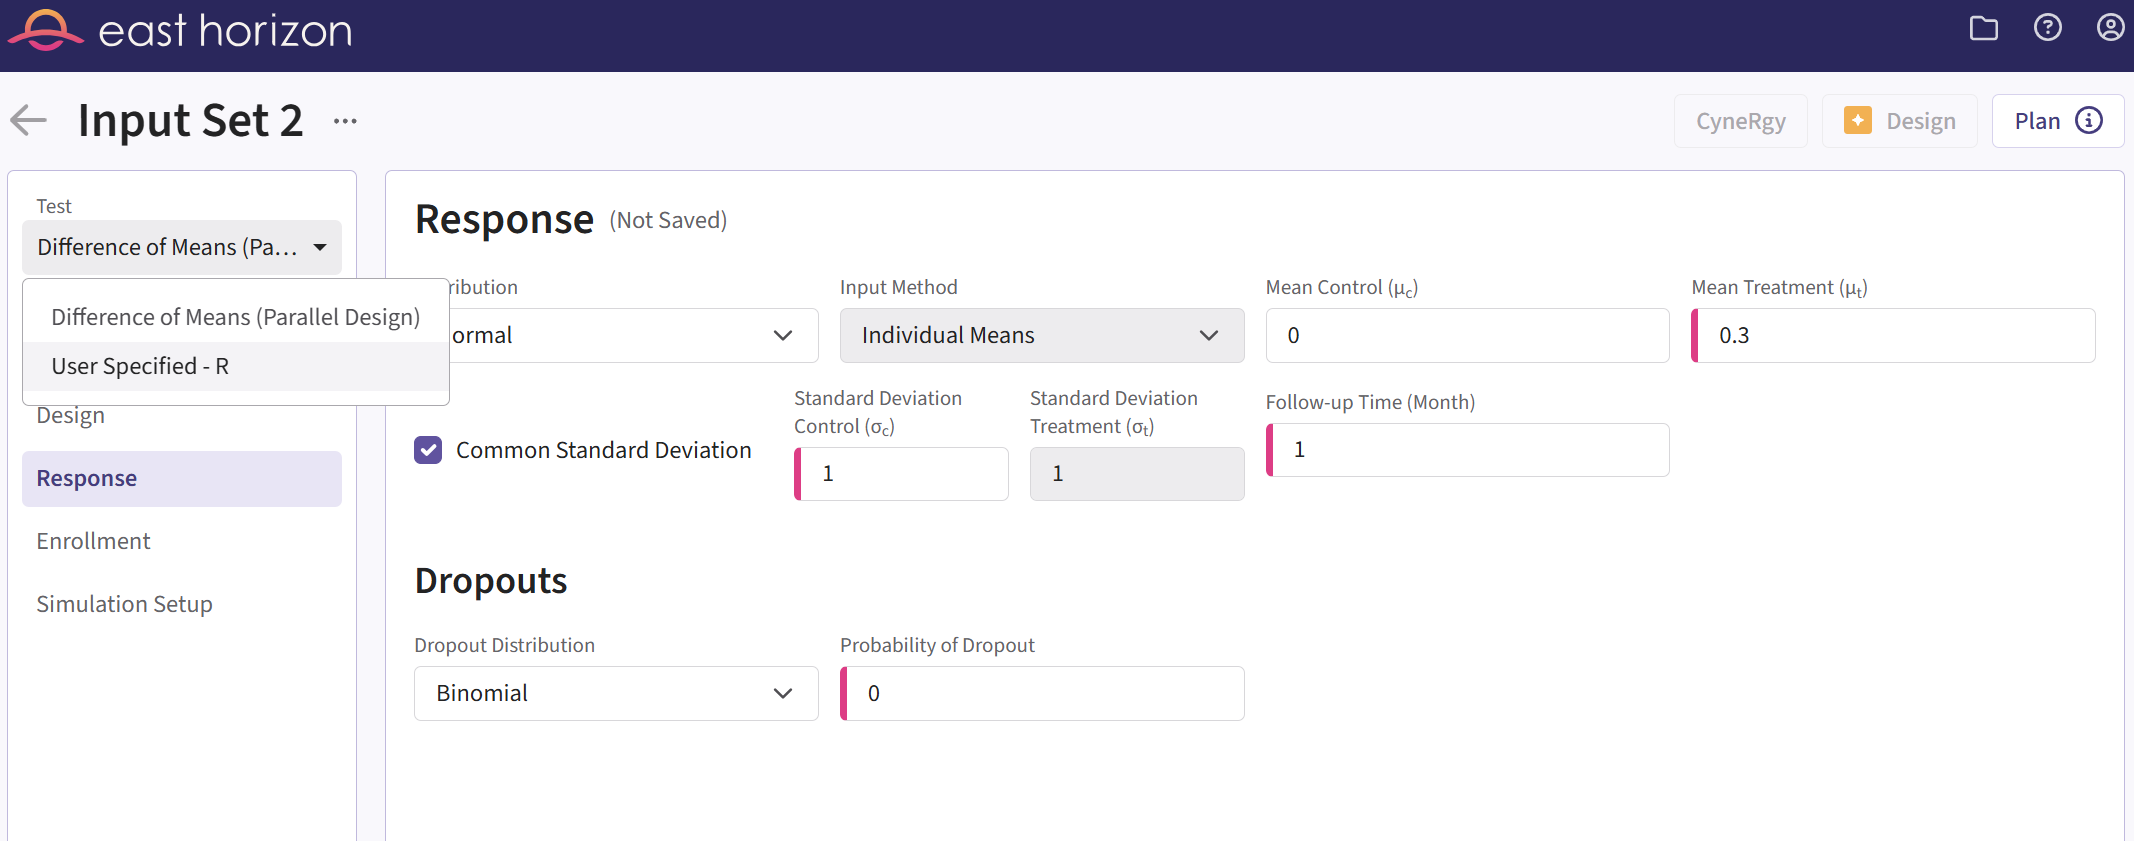
In East Horizon Explore
You can set up an analysis function under Test or Test Statistic in a Design Card while creating or editing an Input Set.
Follow these steps (click to expand/collapse):
- Select User Specified-R from the dropdown in the Test field in the Design Card.
- Browse and select the appropriate R file (
filename.r) from your computer, or use the built-in R Code Assistant to create one. This file should contain function(s) written to perform various tasks to be used throughout your Project. - Choose the appropriate function name. If the expected function is not displaying, then check your R code for errors.
- Set any required user parameters (variables) as needed for your function using + Add Variables.
- Continue creating your project.
For a visual guide of where to find the option, refer to the screenshots below:
For Time-to-event outcomes, the option is available under General in the Test Statistic field.
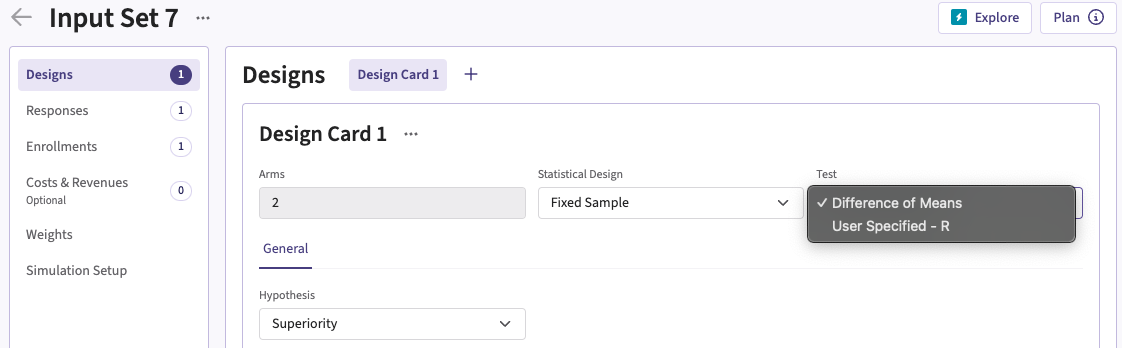
In East Horizon Design
You can set up an analysis function under Test in the sidebar of an Input Set created by simulation.
Follow these steps (click to expand/collapse):
- Create an simulation input set. For some tests, you may need to create an analytical design input set first. If so, follow the steps 2 and 3. If not, skip to step 4.
- Navigate to the Results section and simulate the analytical design.
- Navigate to the new simulation input set that was created.
- Select User Specified-R from the dropdown in the Test field of the sidebar.
- Browse and select the appropriate R file (
filename.r) from your computer, or use the built-in R Code Assistant to create one. This file should contain function(s) written to perform various tasks to be used throughout your Project. - Choose the appropriate function name. If the expected function is not displaying, then check your R code for errors.
- Set any required user parameters (variables) as needed for your function using + Add Variables.
- Continue creating your project.
For a visual guide of where to find the option, refer to the screenshot below:
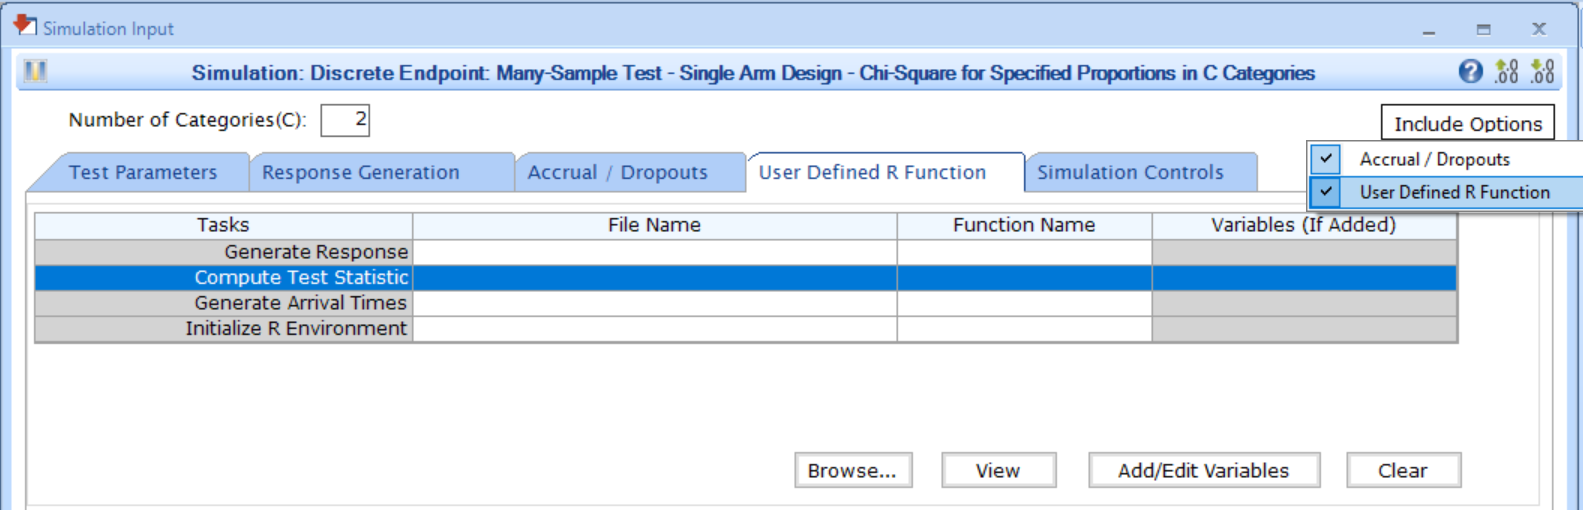
In East
You can set up an analysis function by navigating to the Compute Test Statistic task of the User Defined R Function tab of a Simulation Input window, after including the option.
Follow these steps (click to expand/collapse):
- Choose the appropriate test in the Design tab.
- If you see the Design Input window, compute the scenario using the Compute button, save the design using the Save in Workbook button, then navigate to the Simulation Input window by clicking on the Simulate Design button under Library.
- Click on the Include Options button on the top right corner of the Simulation Input window and select both Accrual / Dropouts and User Defined R Function.
- In the tab User Defined R Function, a list of tasks will appear. Place your cursor in the File Name field for the task Compute Test Statistic.
- Click on the button Browse… to select the
appropriate R file (
filename.r) from your computer. This file should contain function(s) written to perform various tasks to be used throughout your Project. - Specify the function name you want to initialize. To copy the function’s name from the R script, click on the button View.
- Set any required user parameters (variables) as needed for your function using the button Add/Edit Variables.
- Continue setting up your project.
For a visual guide of where to find the option, refer to the screenshot below: