Multiple Endpoints - Patient Simulation
Anoop Singh Rawat, Gabriel Potvin
July 07, 2026
MEPPatientSimulation.RmdThis example is related to the Integration Point: Response - Multiple Endpoints. Click the link for setup instructions, variable details, and additional information about this integration point.
- Study objective: Two Arm Confirmatory - Multiple Endpoints
- Number of endpoints: Multiple Endpoints (any number)
- Endpoint type: Any combination of Time-to-Event, Binary, and Continuous
- Task: Explore or Design
Introduction
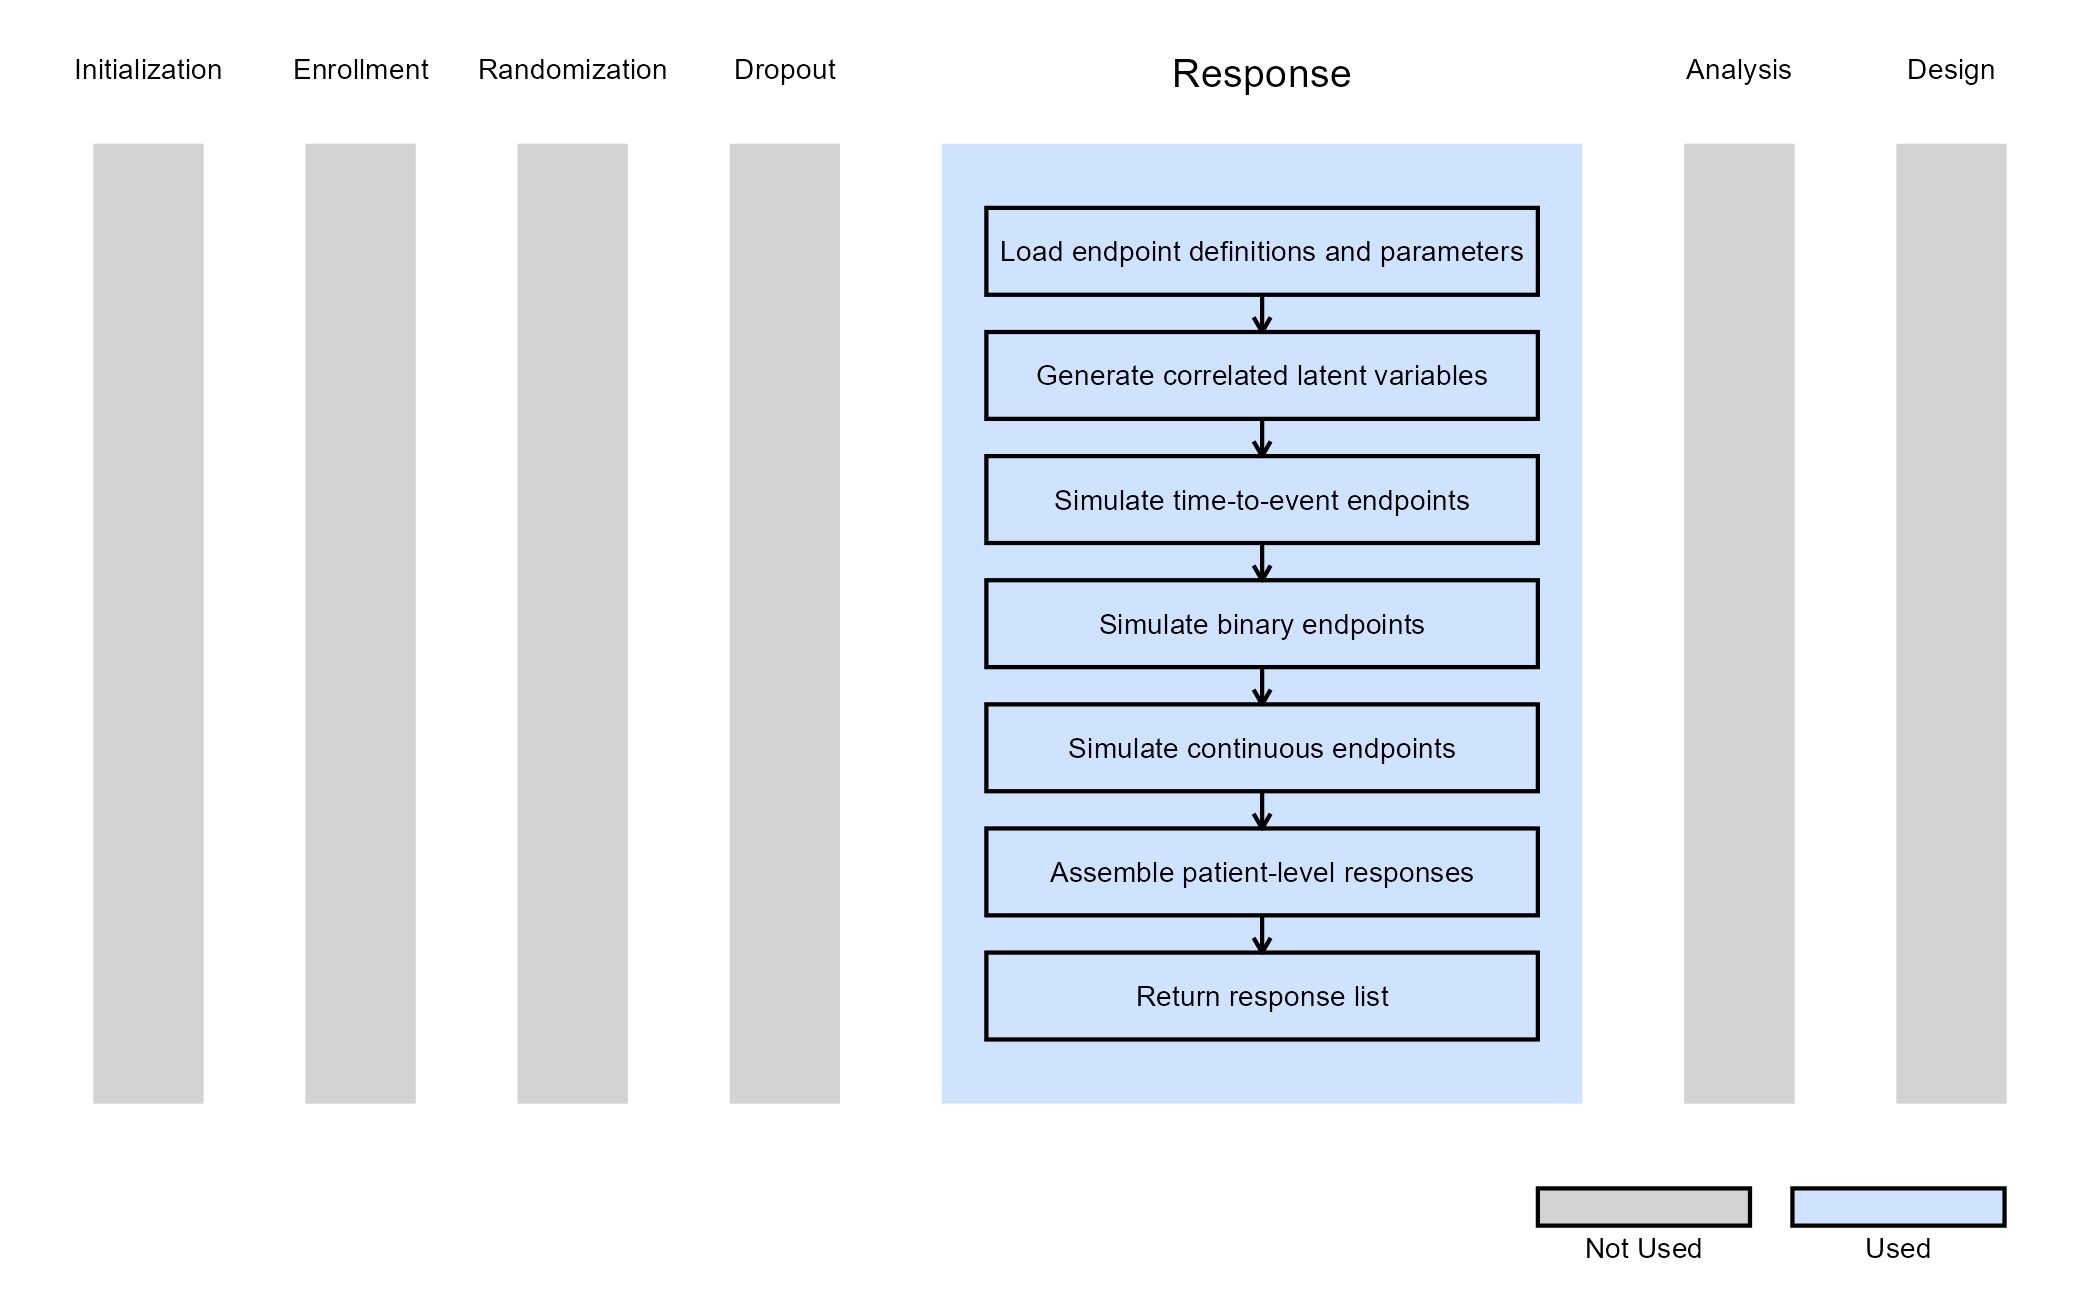
This example illustrates how to integrate new patient outcome simulation (response) capabilities into East Horizon using R functions in the context of 2-arm clinical trials with multiple endpoints. The example combines time-to-event, binary, and continuous outcomes within a single response-generating function.
In the R directory of this example you will find the following R file:
- GenerateMEPResponse.R - This file contains the response-generation logic used to simulate patient-level outcomes across multiple endpoints.
Example 1 - Simulate Response for Multiple Endpoints
This example is related to this R file: GenerateMEPResponse.R
The function GenerateMEPResponse simulates patient-level outcomes for a two-arm clinical trial with an arbitrary number of endpoints. Each endpoint can independently be defined as continuous, binary, or time-to-event. All endpoints are generated within a single unified Response function. No user-defined parameters are used in this example.
Important inputs to the function include:
-
EndpointType: Defines the type of each endpoint (0= Continuous,1= Binary,2= TTE). -
EndpointName: Character vector containing endpoint names. These names are used as keys inRespParamsand the returned response list. -
RespParams: A list of endpoint-specific parameter lists. Each endpoint entry contains control and treatment parameters appropriate to its type. -
Correlation: A correlation matrix of dimension (Number of Endpoints Number of Endpoints) used to induce correlation across all endpoints.
To model correlation between endpoints, the function:
- Generates independent standard normal variables for all patients and endpoints.
- Applies a Cholesky decomposition of the correlation matrix.
- Transforms the normal variables to obtain correlated latent responses.
These correlated latent variables are then mapped to endpoint-specific outcomes depending on the endpoint type.
Time-to-Event Endpoints
Time-to-event endpoints are generated using an exponential survival model. The function supports either of the three alternative parameterizations methods (Hazard rate, Cumulative survival percentages, Median survival times) as chosen in East Horizon.
Treatment effects are incorporated through a hazard ratio (HR) applied multiplicatively to the control hazard. For each patient, the survival time is generated by transforming the correlated normal variable into a uniform variable and applying the inverse exponential survival function. The resulting outcome represents the event time for each patient.
Binary Endpoints
Binary endpoints are generated using a latent normal threshold model
using control and treatment response probabilities provided in
RespParams. These probabilities are converted into
probit-scale thresholds. Then, the correlated latent normal variable is
compared against the arm-specific threshold to determine the binary
outcome. With this approach, we ensure consistency between marginal
response rates and the specified correlation structure.
Continuous Endpoints
Continuous endpoints are generated from normal distributions, with
arm-specific mean and standard deviation parameters via the lists
RespParams$Treatment and RespParams$Control.
Each list contains two elements: the mean (e.g.,
RespParams$Treatment[1]) and the standard deviation (e.g.,
RespParams$Treatment[2]). The correlated latent normal
variable is scaled and shifted according to the treatment assignment to
produce the final outcome.
The final responses are returned for each endpoint and patient.
The figure below illustrates where this example fits within the R integration points of Cytel products, accompanied by a flowchart outlining the general steps performed by the R code.