Time-To-Event Weighted Conditional Power Futility Analysis
Gabriel Potvin, Valeria A. G. Mazzanti, Sheetal Solanki
July 07, 2026
TimeToEventConditionalPowerFutilityAnalysis.RmdThis example is related to the Integration Point: Analysis - Time-to-Event Outcome. Click the link for setup instructions, variable details, and additional information about this integration point.
- Study objective: Two Arm Confirmatory
- Number of endpoints: Single Endpoint
- Endpoint type: Time-to-Event Outcome
- Task: Design
- Test: Logrank Test Given Accrual Duration and Study Duration (Parallel Design)
- Statistical Design: Group Sequential, 1 IA
Introduction
This example demonstrates how to perform a time-to-event (TTE) analysis with an evaluation of futility at an interim look by extending East Horizon: Design’s functionalities using a custom R script for the Analysis integration point. The analysis of patient data is based on the Logrank test and the interim analysis evaluates futility based on a Conditional Power threshold, which is computed using a weighted hazard ratio.
In this example, we set up in East Horizon a Two Arm Confirmatory trial with a single TTE endpoint using the Design task and the Logrank Test Given Accrual Duration and Study Duration (Parallel Design) option. In East Horizon: Design, custom R scripts can only be applied during simulations. Therefore, an analytical design must first be created, after which simulations can be run based on its computation. During the simulation, the futility evaluation from the original design is replaced by the custom futility logic implemented in the R script.
Why do we need R Integration for this example?
East Horizon: Design’s built-in analysis algorithms do not natively support computation of a weighted conditional power using both the assumed hazard ratio and the observed hazard ratio at any interim analysis. This requires integrating a custom R file for the Analysis step which will:
- Compute the Logrank test statistic and p-value at interim & final analyses.
- Estimate the hazard ratio from interim data.
- Compute conditional power using either the target hazard ratio (i.e. original assumption), the estimated hazard ratio (i.e. observed at each analysis), or a weighted combination of the two.
- Apply futility or efficacy decision rules based on pre-specified boundaries, specified as conditional power thresholds.
By integrating this R file, East Horizon users can perform adaptive interim analyses with custom decision rules that are not supported in the default framework, allowing more flexible and realistic trial simulations.
What does the R function do?
In the R directory of this example you will find the following R file:
-
AnalzyeTTEWithConditinalPowerFutility.R
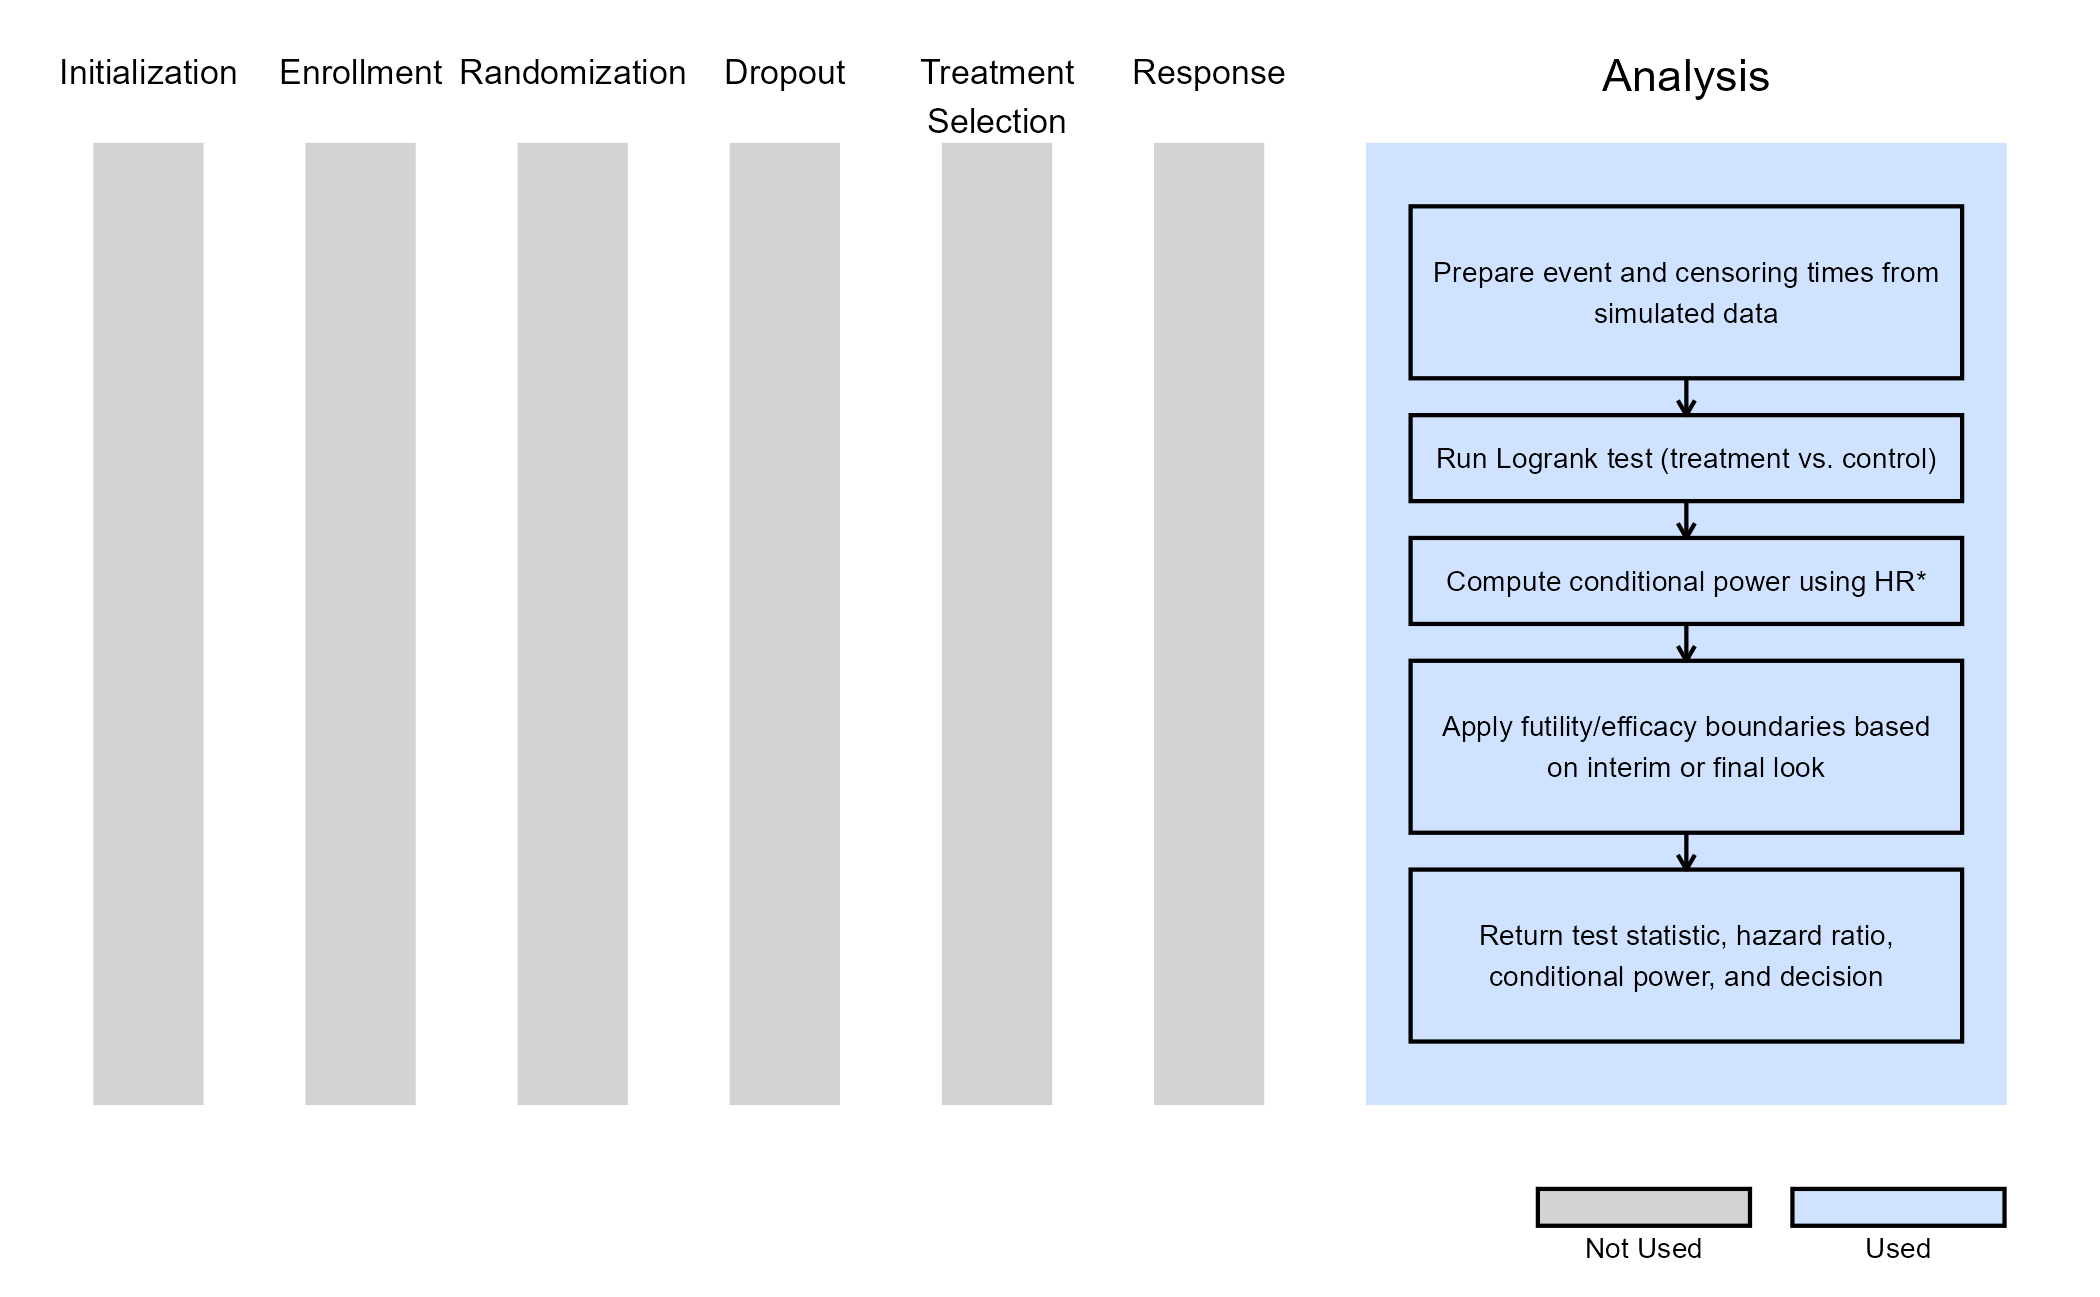
This R file contains a function that analyzes simulated time-to-event clinical trial data at interim or final analyses. It prepares the event and censoring information, runs a log-rank test to compare treatment groups, and then calculates conditional power based on either a target hazard ratio, the estimated hazard ratio, or a weighted mix of both. It applies futility rules using this conditional power at interim looks to decide whether the trial should stop early or continue, and then uses the traditional Logrank test for the efficacy/futility decision at the final look. The function returns the test statistic, estimated hazard ratio, conditional power, and a decision code indicating the outcome.
For more information on this function, see the Technical Information and Example Values section below.
Technical Information and Example Values
This example is related to this R file: AnalzyeTTEWithConditinalPowerFutility.R
We begin by preparing the simulated trial data based on the design parameters and current look index.
We then perform the Logrank test, which compares survival between treatment and control arms. The test statistic () is computed as:
where:
- is the Logrank chi-square statistic.
- and are the observed and the expected number of events in the treatment group.
The corresponding -value () is:
where is the cumulative distribution function (CDF) of a chi-square with 1 degree of freedom.
We also compute the standard error of log hazard ratio () as:
where:
- is the number of events at the time of analysis.
- where is the ratio of the treatment arm sample size to the control arm sample size.
Next, the conditional power (), or in other words the probability of ultimately crossing the efficacy boundary given the interim results, is calculated as:
where:
- is the standard normal cumulative distribution function (CDF).
- is the critical value we set for the efficacy boundary on the Z-test statistic scale (in this case, using a one-sided significance level of 2.5%).
- is the number of events at the first look (interim analysis).
- is the number of events at the second look (final analysis).
- depends on the computation option (see below).
The futility decision rule at the interim analysis is:
The decision rule at the final analysis is:
Option 1: Target Hazard Ratio
In this option, the conditional power is computed using a user-specified target hazard ratio:
To enable this option, set nComputationOption = 1 and provide values for both FutilityThreshold and TargetHazardRatio, as shown in the table below.
| User parameter | Definition | Example Value |
|---|---|---|
| nComputationOption | Computation Option | Must be 1 |
| FutilityThreshold | Futility Threshold | 0.1 |
| TargetHazardRatio | Target Hazard Ratio | 0.66 |
This option is equivalent to using East Horizon: Design’s built-in functionality when specifying Futility information at the computation stage, by selecting Conditional Power under Futility Boundary Family and choosing Design HR for the Compute CP Using input field.
Option 2: Estimated Hazard Ratio
For this option, the conditional power is computed using an estimated hazard ratio derived from interim data:
where:
- is the Logrank test statistic, as defined before.
- is the standard error of log hazard ratio, as defined before.
To enable this option, set nComputationOption = 2 and provide a value for FutilityThreshold, as shown in the table below.
| User parameter | Definition | Example Value |
|---|---|---|
| nComputationOption | Computation Option | Must be 2 |
| FutilityThreshold | Futility Threshold | 0.1 |
This option is equivalent to using East Horizon: Design’s built-in functionality when specifying Futility information at the computation stage, by selecting Conditional Power under Futility Boundary Family and choosing Estimated HR for the Compute CP Using input field.
Option 3: Weighted Hazard Ratio
In this option, the conditional power is computed using a weighted hazard ratio that combines the estimated hazard ratio from interim data with a user-specified target hazard ratio:
where:
- is the weight assigned to the estimated hazard ratio.
- is the weight assigned to the target hazard ratio.
- is the user-specified target hazard ratio.
To enable this option, set nComputationOption = 3 and provide values for FutilityThreshold, TargetHazardRatio, WeightEstimatedHR, and WeightTargetHR, as shown in the table below.
| User parameter | Definition | Example Value |
|---|---|---|
| nComputationOption | Computation Option | Must be 3 |
| FutilityThreshold | Futility Threshold | 0.1 |
| TargetHazardRatio | Target Hazard Ratio | 0.7 |
| WeightEstimatedHR | Weight assigned to the estimated hazard ratio | 0.5 |
| WeightTargetHR | Weight assigned to the target hazard ratio | 0.5 |
Unlike Options 1 and 2, this option cannot be implemented using East Horizon: Design’s built-in functionality. It is only available through R integration.
Results
We ran 10,000 simulation replicates for each configuration using the example values of the tables above. The results are summarized below:
| Option | Average Power at Termination |
|---|---|
| Option 1 (built-in) | 0.905 |
| Option 1 (with R) | 0.898 |
| Option 2 (built-in) | 0.901 |
| Option 2 (with R) | 0.895 |
| Option 3 (with R, simulated on Option 1) | 0.900 |
| Option 3 (with R, simulated on Option 2) | 0.920 |
| Option | Futility stops at analysis 1 | Futility stops at analysis 2 | Total futility stops |
|---|---|---|---|
| Option 1 (built-in) | 11 | 941 | 952 |
| Option 1 (with R) | 12 | 1009 | 1021 |
| Option 2 (built-in) | 514 | 480 | 994 |
| Option 2 (with R) | 536 | 519 | 1055 |
| Option 3 (with R, simulated on Option 1) | 8 | 993 | 1001 |
| Option 3 (with R, simulated on Option 2) | 4 | 800 | 804 |
For Options 1 and 2, the results obtained via the built-in East Horizon functionality are almost identical to those produced using the R integration, confirming the correctness of the custom implementation.
For Option 3, results depend on which analytical design (Option 1 or Option 2) was used as the baseline for simulation. As this method is not available using East Horizon: Design’s built-in functionality, the sample size and number of events required to reach a target power using this method must be identified by running a range of simulations with varying sample size and number of events values. The weighted hazard ratio approach can be particularly valuable in situations where users want to balance evidence from observed interim data with prior expectations about the treatment effect.
In conclusion, these results demonstrate that the R script successfully reproduces East Horizon’s built-in functionality where available and extends its capabilities to new features such as weighted hazard ratios.